Python matplolib exemple
Matplotlib
Matplotlib is a powerful Python library for creating static, animated, and interactive visualizations. It provides an interface for plotting graphs and is widely used in scientific computing, data analysis, and machine learning for creating publication-quality figures.
Useful parameters
This code updates matplotlib’s default plotting parameters for better visualization:
Key parameters:
-
font.size: Controls text size in plots (18 is recommended for reports when saving full screen plot) -
figure.autolayout: Automatically adjusts layout to prevent overlapping elements -
figure.figsize: Defines default figure dimensions in inches (width, height)
plt.rcParams.update({
	"font.size": 18,        # Sets base font size to 18 (optimal for fullHD displays)
	"figure.autolayout": True,   # Enables automatic layout adjustments
	"figure.figsize": (12.8, 7.2)    # Sets default figure dimensions
})
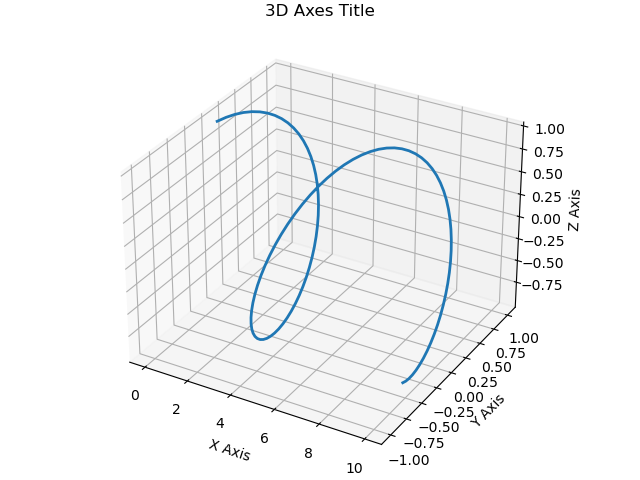
3D plot
fig = plt.figure("Figure title", layout="constrained")
ax = fig.add_subplot(projection='3d')

ax.set_title("3D Axes Title")
ax.set_xlabel("X Axis")
ax.set_ylabel("Y Axis")
ax.set_zlabel("Z Axis")

ax.plot(x, y, z, ls='-', lw=2, color='C0', label="3D Line")

plt.show()

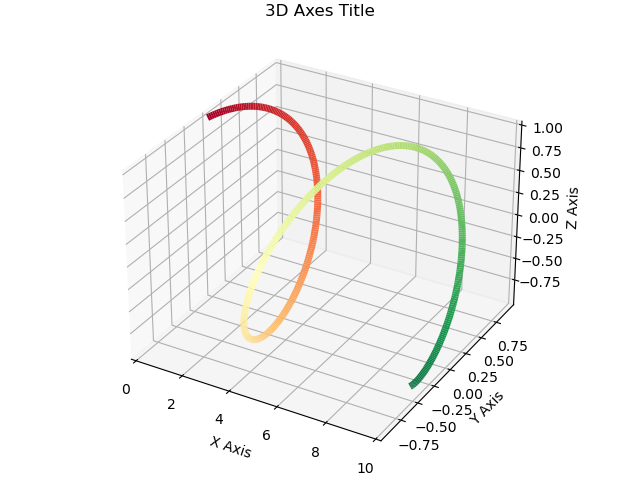
Colored 3D plot
This is useful for coloring plot with the error
from mpl_toolkits.mplot3d.art3d import Line3DCollection

fig = plt.figure("Figure title", layout="constrained")
ax = fig.add_subplot(projection='3d')

ax.set_title("3D Axes Title")
ax.set_xlabel("X Axis")
ax.set_ylabel("Y Axis")
ax.set_zlabel("Z Axis")

xyz = np.array([x, y, z]).T
segments = np.stack([xyz[:-1, :], xyz[1:, :]], axis=1)
cmap = plt.cm.get_cmap("RdYlGn")

# Ranging colors
norm = plt.Normalize(time.min(), time.max())
lc = Line3DCollection(segments, linewidths=5, colors=cmap(norm(time[:-1])))
ax.add_collection3d(lc)

ax.set_xlim(x.min(), x.max())
ax.set_ylim(y.min(), y.max())
ax.set_zlim(z.min(), z.max())
In the exemple, I took time as color

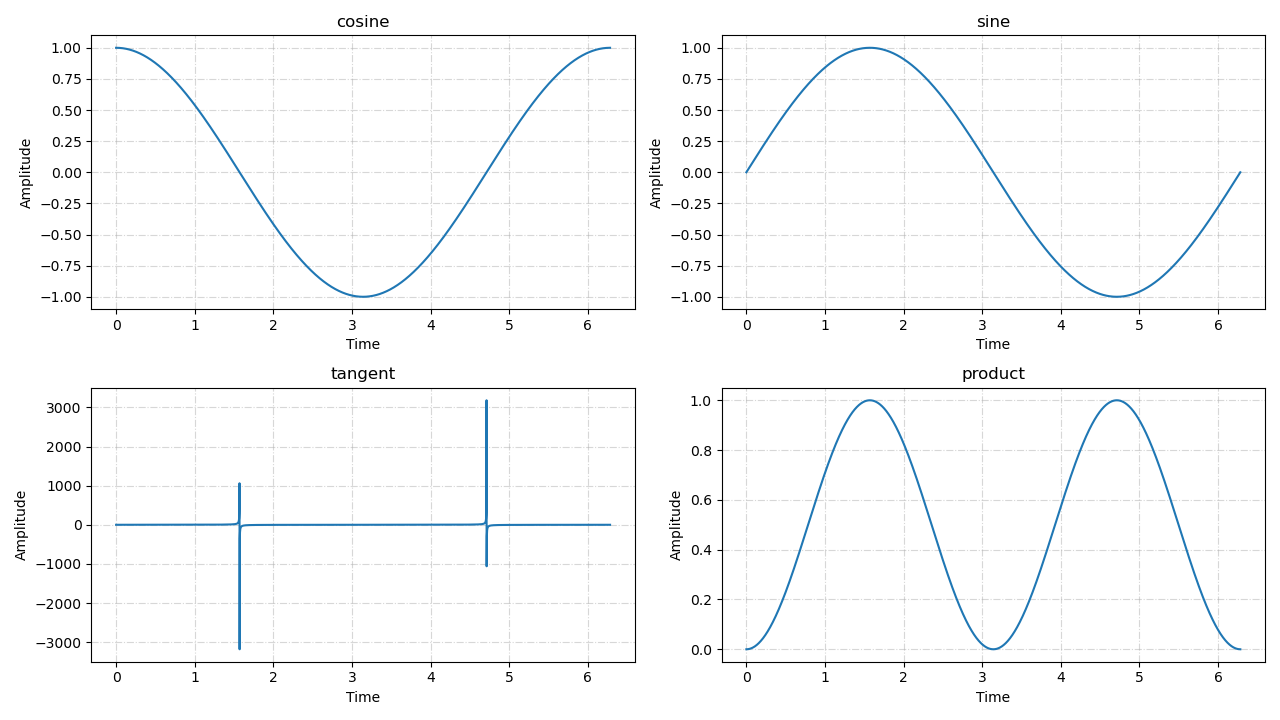
Multi curve plot
fig, axs = plt.subplots(2, 2, num="Figure title")

axs[0,0].set_title("cosine")
axs[0,1].set_title("sine")
axs[1,0].set_title("tangent")
axs[1,1].set_title("product")

axs[0,0].plot(time, x)
axs[0,1].plot(time, y)
axs[1,0].plot(time, z)
axs[1,1].plot(time, w)

axs[0,0].set_xlabel("Time")
axs[0,1].set_xlabel("Time")
axs[1,0].set_xlabel("Time")
axs[1,1].set_xlabel("Time")

axs[0,0].set_ylabel("Amplitude")
axs[0,1].set_ylabel("Amplitude")
axs[1,0].set_ylabel("Amplitude")
axs[1,1].set_ylabel("Amplitude")

axs[0,0].grid(ls="-.", alpha=0.5)
axs[0,1].grid(ls="-.", alpha=0.5)
axs[1,0].grid(ls="-.", alpha=0.5)
axs[1,1].grid(ls="-.", alpha=0.5)
